-->
LATEST HEADLINES
66th REPUBLIC DAY WISHES TO ALL INDIANSZizix Tutorials
LATEST POSTS TIME OF NOW
Showing posts with label DROUGHT RESEARCH. Show all posts

Pilot plant for removal of extreme gas charges from deep waters

Pit Lake Guadiana in the former mining area Herrerias in Andalusia, Spain.
Credit: : Bertram Boehrer/UFZ
Being part of the mining area Herrerias in Andalusia, deep waters of Pit Lake Guadiana show extremely high concentration of dissolved carbon dioxide (CO2). In the case of a spontaneous ebullition, human beings close-by would be jeopardized. To demonstrate the danger and the possible solution, scientists of the Spanish Institute of Geology and Mining, the University of the Basque Country (UPV/EHU, Bilbao) and the Helmholtz Centre for Environmental Research (UFZ) constructed a pilot plant for degassing. A fountain pulls deep water through a pipe to the surface, where the gas can escape from the water. The buoyancy produced by the bubbles provides the energy required for driving the flow.

"The deep water in the residual lake Guadiana contains an extremely high volume of carbon dioxide (CO2). Oxidation of ores has created a very acidic milieu, which is also known from other mining areas. In the mining area Herrerias however, this acidity dissolves carbonate from the rocks and produces carbonic acid (dissolved CO2), which can be accumulated under the high pressures of deep waters in the lake. There is not much circulation beyond 25 meter depth to remove the gas load" says Dr. Bertram Boehrer of UFZ, who is physicist and has been investigating stratification in lakes at many places on Earth. Due to the high hydrostatic pressure, each liter of deep water contains about 2.5 liters of CO2 gas. As long as the stratification remains stable, the gas is retained in the deep water. A land slide or other processes producing large water movements could facilitate a sudden release of gas previously confined under high pressure. Inhaled air of 8 percent CO2 are considered deadly for humans.

Now the scientists installed a degasing pipe which is the heart of the new pilot plant: Deep water enters a pipe at 61m depth. On the way up, hydrostatic pressure drops and gas bubbles form. The reduced density of the water-gas-mixture allows that deep water is pushed out of the pipe at the upper end to form a fountain above the water table, where gas is released to the atmosphere. This is an elegant solution, as the system does not require any additional driver, and the controlled release of CO2 does not pose any problem. "With this pilot plant, we could demonstrate that this approach also works in Guadiana pit lake. This can now be proposed to authorities as a possible approach to deal with the gas load." Though the lake in the mining area is fenced and access is not permitted to the public, this prohibition is difficult to survey.

Earlier installations in Lake Nyos in Cameroon served as a good example for this approach. In this lake, degassing pipes had been installed, which released the gas load with three fountains. On August 21st 1986, a large volume of gas escaped from the lake suddenly. The gas entered valleys of the surrounding area. 1700 human beings and thousands of animals were killed. The trigger could have been a land slide though this was never really proven. To avoid a repetition of this disaster, the gas load is slowly removed from the lake. One more crater lake called Monoun in Cameroon suffocated 37 human beings close to its shores in a similar eruption. Also in Monoun degasing fountains have been installed.

In Guadiana pit lake we do not see the same danger as in Lake Nyos, due to smaller size and depth. In addition, a density gradient between surface waters and deep waters is keeping the system stable. However, gas concentrations are so high that precaution must be taken. More detailed investigations must be implemented and remediation must be considered, says Dr. Boehrer. For the formation of such extreme gas loads, lakes must be sufficiently deep with incomplete winter recirculation (meromixis) and a strong carbon dioxide source. At the moment, we do not have such a lake in Germany.

Source: Helmholtz Centre for Environmental Research - UFZ

New method for detecting water on Mars

Washington State University senior Kellie Wall has helped develop a new method for detecting water on Mars. Her findings appear in Nature Communications, one of the most influential general science journals. Credit: Washington State University photo
A Washington State University undergraduate has helped develop a new method for detecting water on Mars.  

Kellie Wall, 21, of Port Orchard, Wash., looked for evidence that water influenced crystal formation in basalt, the dark volcanic rock that covers most of eastern Washington and Oregon. She then compared this with volcanic rock observations made by the rover Curiosity on Mars' Gale Crater.

"This is really cool because it could potentially be useful for not only the study of rocks on Earth but on Mars and other planets," said Wall.

She is the lead author of the article in Nature Communications.  

Co-authors include Michael Rowe, a former WSU research professor now at New Zealand's University of Auckland, and Ben Ellis, a former WSU post-doctoral researcher now at the Institute of Geochemistry and Petrology in Zurich, Switzerland. The other authors are Mariek Schmidt of Brock University in Canada and Jennifer Eccles of the University of Auckland.

Wall was fascinated by volcanoes as a child, touring the Cascade mountain range with her father and marveling at features like the lava tubes under Mount St. Helens.

"I was really excited because I thought that just on the other side of the walls there could be lava," she said.

Still, she started out as a communications major at WSU, choosing a geology class to fulfill a science requirement.

"I loved it so much that I changed my major," she said.

In her sophomore year, Rowe and Ellis asked if she would like to look at the eruption styles of Earth and Mars volcanoes.

"I was really crazy about it -- really intrigued by the buzzword 'Mars,'" she said.

"I've worked with a lot of undergraduate researchers over the years and she's the best that I've come across," said Rowe. "That's why we gave her so much responsibility on this project, because we knew she would do it well."

The researchers established a method to quantify the texture of volcanic rock using an index called "groundmass crystallinity." Wall compares it to the texture of a chocolate chip cookie, which can vary according to how it is cooked and cooled.

"We were interested in the cookie dough part of the cookie," she said.

Liquid volcanic rock cools rapidly as it hits water, flash-freezing to form mostly glass. Without water, it takes longer to cool and forms crystals within the groundmass, the cookie dough part.

Using an x-ray diffraction machine on the WSU campus, home to one of the most sophisticated basalt labs in the world, Wall analyzed rock samples from the Northwest, New Zealand and Italy's Mount Etna and compared them to rocks analyzed by Curiosity's x-ray diffractometer.

"The rocks that erupted and interacted with water, which we call phreatomagmatic, all had a groundmass crystallinity as low as 8 percent and ranging up to about 35 percent," she said. 

"The rocks that erupted without interaction with water had groundmass crystallinities from about 45 percent upwards to almost totally crystalline.

"The analyses we did on the Mars soil samples fell in the range of the magmatic type eruptions, which are the ones erupted without water interaction," she said.

Water is a key indicator for the potential of microbial life on the red planet. While Wall and her colleagues didn't see evidence of it from two sites they studied, their method could look for water elsewhere.

"I think this quantification of volcanic textures is a new facet of the water story that hasn't yet been explored," Wall said. "Most of the studies searching for water have focused on either looking for sedimentary structures -- large- and small-scale -- for evidence of water, or looking for rocks like limestones that actually would have formed in a water-rich environment.

"But being able to determine the environment through the texture of a volcanic rock is something pretty cool and different," she said. "I think it's an interesting avenue for future research."

Source: Washington State University

Move over smart cities, the Internet of Things is off to the country

Smart sheep
 Lancaster University is about to take the concept of smart cities out of town. Computer scientists at Lancaster University are investigating how the Internet of Things could work in the countryside.

The Internet of Things - which enables object-to-object communication over the internet and real time data monitoring - has typically been associated with urban environments and until now the countryside has been left out in the cold.

Computer scientist Professor Gordon Blair of Lancaster University has won £171,495 from the Engineering and Physical Sciences Research Council to lead a new project in Conwy, North Wales, which will investigate how the Internet of Things could work in the countryside.

Working with partners at the Centre for Ecology and Hydrology, The British Geological Survey and Bangor University, the project launched on December 1 and will run for 18 months.

Problems from flooding and agricultural pollution to animal movements and drought could all potentially benefit from smart technology in the sticks.

The Internet of Things, which takes everyday objects and hooks them up to the internet, represents a shift in the way we gather and engage with information. Applying this booming technology to the countryside presents challenges – for example how to build a network when there are mountains and trees in the way – but researchers believe the benefits could be huge.

Sheep with digital collars, sensors on riverbanks, rainfall and river flow monitors could all soon form part of the project.

Professor Blair said: “Cities have been the focus of much of the boom in this type of technology – it has been used to keep traffic flowing on our roads, monitor air pollution and even help us find a parking spot on a busy Saturday afternoon. But the countryside faces challenges of its own, from subtle environmental changes to catastrophic events such as flooding. The possibilities of bringing the Internet of Things to the countryside are limitless. The next step will be to identify exactly what will be of most use in the short term and how we will frame the project.”

Source: Lancaster University

Tree diseases can help forests

A healthy seedling of the tree Castilla elastica is on the left, while a dying seedling, attacked by a plant pathogen, is on the right. A study in the Journal of Ecology by University of Utah biologists shows that such tree diseases, while killing individual seedlings, can increase forest biodiversity. Credit: Erin Spear, University of Utah.
Plant diseases attack trees and crops and can hurt lumber and food production, but University of Utah biologists found that pathogens that kill tree seedlings actually can make forests more diverse.

While low rainfall has been blamed for a lack of drought-sensitive trees near the Pacific side of the Panama Canal, the new study answers a mystery about what keeps drought-tolerant trees from that area from living along the wetter Caribbean side of the canal. The answer: disease-causing plant pathogens, the researchers report in their study, published online Wednesday, Nov. 12 by the Journal of Ecology.

"Because seedlings of disease-sensitive tree species can't survive in the wetter forests and drought-sensitive tree species cannot survive in the drier forests, different tree species inhabit the wetter and drier forests even though they are only 30 miles apart" in Panama, says Phyllis Coley, a senior author of the study and a distinguished professor of biology.
In other words, tree pathogens contribute to the staggering diversity of trees in Panama's tropical forests, she adds.

The study's first author, biology doctoral student Erin Spear, says that is important because "conservation planning and predictions about how tree species distributions may shift with climate change require an understanding of the factors currently influencing where species can and cannot survive."

That is particularly important in tropical forests and other forests that are under elevated threat of deforestation.

Funding for the study came from Sigma Xi -- The Scientific Research Society, the Smithsonian Institution and the National Science Foundation.

Of Forests and Pathogens

Tropical forests are threatened, and dry tropical forests are even more threatened because sunnier, drier climates are better for growing crops and are favored by people. Some 90 percent of Panama's residents live on the nation's drier Pacific slope.

Forests are essential for feeding and sheltering animals, providing important medicines, storing carbon and water, and reducing erosion by holding soil in place. These functions are influenced by different species inhabiting a forest, so it is essential to understand why certain tree species can survive in certain areas but not others.

Panama's forests also are important economically because tree roots limit how much soil erodes into the Panama Canal, ensuring that huge container ships can pass. Researchers also believe the forests help maintain water levels in the canal because forest soil stores water, slowly releasing it into streams feeding the canal during the dry season.

Diversity is high in tropical forests. A 930-square-mile area bordering the Panama Canal has more than 800 tree species. By comparison, about half the state of Rhode Island -- or some 610 square miles -- is forested, and that area has only 51 tree species.

Part of the reason Panama's forests have more species is because the Pacific end of the canal receives less annual rainfall -- about 5.9 feet -- than the Caribbean end, where 9.8 feet of rain falls annually.

"While there is considerable evidence that less rain in the drier, Pacific forests means that drought-sensitive tree species can't survive there, it has been unclear what prevents the drought-tolerant species of the drier forests from living in the wetter forests," says University of Utah biology professor Tom Kursar, the study's other senior author. "Our study tackled that unanswered question."

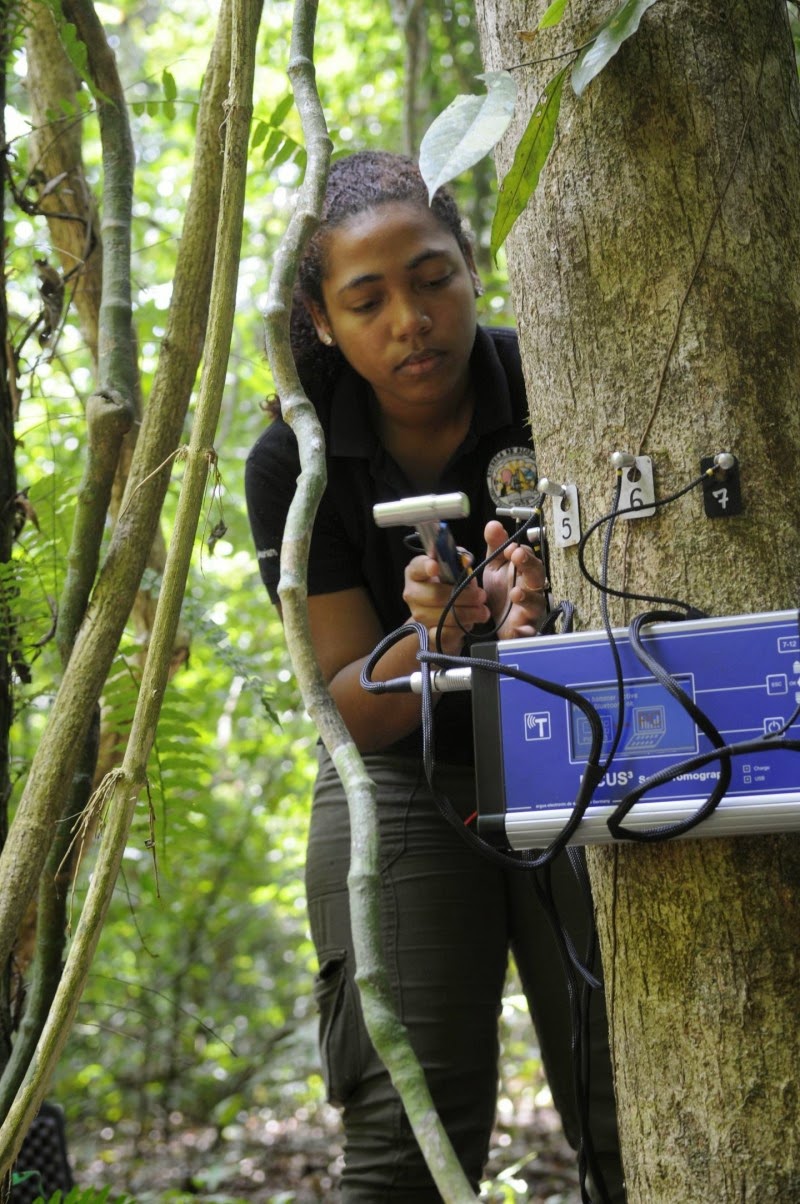
So Spear braved mud, rain, insects and snakes to monitor seedlings of a variety of tree species in the wetter and drier forests of central Panama for pathogen-caused damage and death. Plant pathogens that make plants sick include bacteria, viruses and fungi.

Spear says the researchers' findings suggest that "all seedlings are at a greater risk of being injured and killed by pathogens in the wetter forests than in the drier forests." This could be because the damp environment of the wetter forests helps pathogens survive, and more rainfall helps pathogens move from one seedling to another.

But that's only half the story. Coley says that their study indicates "pathogens are implicated in the absence of the dry-forest tree species from the wetter forests, where they might otherwise be able to live. That is because dry-forest tree species are more likely to die from pathogen attack than wet-forest species."

Diagnosing Sick Seedlings

Spear collected the seeds for the study by hiking for miles, kayaking in the canal to collect fruit from overhanging branches, and even riding a crane-carried gondola more than 100 feet upward into the forest canopy.

She conducted the study at two forest sites in central Panama: one at the large Metropolitan Natural Park in Panama City on the drier Pacific side, and one on private property in the Santa Rita Ridge area on the wetter Caribbean side. She planted "gardens" of tree seeds -- including species typical of wetter and drier forests -- in 30 locations at each site. More than 1,000 seeds were planted; 725 of them sprouted.

Once the seeds were planted, the researchers covered them with wire mesh to protect the seeds and seedlings from being crushed by tree branches or eaten by animals.

Spear visited both sites weekly and took notes on the 725 seedlings. Weekly visits were essential because, diseased seedlings can be dead and decomposing within days.

"We monitored when the seeds germinated, the occurrence of and date when symptoms of pathogen attack were observed, if and when a seedling died, and we ascribed a cause of death," Spear says. Pathogen symptoms included patches of black, dead tissue in the leaves or stem. "In some cases, we could actually see the pathogen growing on the seedling," she says.

Of the 725 seedlings that germinated, 38 percent suffered pathogen-caused damage, including 11 percent of seedlings killed by pathogens.

Compared with seedlings in the drier forest, seedlings in the wetter forest were 74 percent more likely to suffer pathogen-caused damage and 65 percent more likely to be killed by pathogens.

"But what was really striking was that pathogen-caused damage was five times more likely to be lethal for seedlings of dry-forest species than for wet-forest species," suggesting dry- and wet-forest species differ in their ability to halt or slow infection, Spear says.

The researchers next plan to identify specific fungi, bacteria and other pathogens and whether they differ in wetter and drier forests.

During her study at the drier park site in Panama City, Spear discussed her research with tourists and other park visitors.

"I'd emerge from the tangles of vines sweaty, muddy and generally disheveled and people couldn't help but ask what I was doing," Spear recalls. "It was heartening to hear how the forest had touched these very different people."

A brief time-lapse video of a seedling dying from pathogen attack during a period of several days can be seen at: http://vimeo.com/58026978 Video by Erin Spear, University of Utah.


Source: University of Utah

If trees could talk: Forest research network reveals global change effects

In addition to identifying, mapping, measuring and monitoring trees in the CTFS-ForestGEO study plots, researchers describe the relatedness of trees, track flower and seed production, collect insects, survey mammals, quantify carbon stocks and flows within the ecosystem, take soil samples and measure climate variables like rainfall and temperature. The thorough study of these plots provides insights into not only how forests are changing but also why. Credit: Beth King, STRI
Permafrost thaw drives forest loss in Canada, while drought has killed trees in Panama, southern India and Borneo. In the U.S., in Virginia, over-abundant deer eat trees before they reach maturity, while nitrogen pollution has changed soil chemistry in Canada and Panama. Continents apart, these changes have all been documented by the Smithsonian-led Center for Tropical Forest Science-Forest Global Earth Observatory, CTFS-ForestGEO, which released a new report revealing how forests are changing worldwide.

"With 107 collaborators we've published a major overview of what 59 forests in 24 countries, where we monitor nearly 6 million trees teach us about forest responses to global change," said Kristina Anderson-Teixeira, first author of the report and CTFS-ForestGEO and ecosystem ecologist based at the Smithsonian Conservation Biology Institute.

Many of the changes occurring in forests worldwide are attributable to human impacts on climate, atmospheric chemistry, land use and animal populations that are so pervasive as to warrant classification of a new geologic period in Earth's history -- the Anthropocene, the Age of Humans.

Measuring and understanding the effects of all these changes -- collectively termed "global change" -- are easier said than done. Some of the best information about these global-scale changes comes from CTFS-ForestGEO, the only network of standardized forest-monitoring sites that span the globe.

Since the censuses began at the first site on Barro Colorado Island in Panama in 1981, atmospheric carbon dioxide has increased by 16 percent. The forest sites in the network have warmed by an average of over 1 degree F (0.6 degree C) and experienced up to 30 percent changes in precipitation. Landscapes around protected sites experience deforestation.
The plot network now includes forests from Brazil to northern Canada, from Gabon to England and from Papua New Guinea to China.

In addition to identifying, mapping, measuring and monitoring trees, researchers describe the relatedness of trees, track flower and seed production, collect insects, survey mammals, quantify carbon stocks and flows within the ecosystem, take soil samples and measure climate variables like rainfall and temperature. The thorough study of these plots provides insights into not only how forests are changing but also why.

Climate change scenarios predict that most of these sites will face warmer and often drier conditions in the future -- some experiencing novel climates with no modern analogs. Forests are changing more rapidly than expected by chance alone, and shifts in species composition have been associated with environmental change. Biomass increased at many tropical sites across the network.

"It is incredibly rewarding to work with a team of forest scientists from 78 research institutions around the world, including four Smithsonian units" Anderson-Teixeira said. "CTFS-ForestGEO is a pioneer in the kind of collaborative effort it takes to understand how forests worldwide are changing."

"We look forward to using the CTFS-ForestGEO network to continue to understand how and why forests respond to change, and what this means for the climate, biodiversity conservation and human well-being," said Stuart Davies, network director.

Source: Smithsonian Tropical Research Institute

Desert streams: Deceptively simple

Dryland channels exhibit very simple topography despite being shaped by volatile rainstorms. Credit: Katerina Michaelides
Volatile rainstorms drive complex landscape changes in deserts, particularly in dryland channels, which are shaped by flash flooding. Paradoxically, such desert streams have surprisingly simple topography with smooth, straight and symmetrical form that until now has defied explanation.

That paradox has been resolved in newly published research conducted by Michael Singer and Katerina Michaelides, associate researchers at UC Santa Barbara's Earth Research Institute. The pair show that simple topography in dryland channels is maintained by complex interactions among rainstorms, the stream flows these storms generate in the river channel and sediment grains present on the riverbed. Their findings appear in the journal Geology.

Desert streams flow only during infrequent but intense rainstorms, and when they do, only parts of the channel contain water, making the flow irregular and erratic. One rainstorm may erode sediment grains in one section of the channel, while another storm moves sediment in a different area.

"Given this localized sediment movement during rainstorms, one might expect desert channels to contain mounds of sediment that undulate down the stream course reflecting the irregular flow, but they don't," Singer said. "The water produced in the channel only flows partially down the stream and then stops because it seeps into the riverbed, and there's not enough water from upstream to replace it, so it just disappears."

Because desert river channels do not feature the river bars, pools or riffles common in perennial streams, they decline in elevation downstream very smoothly. According to the researchers' findings, feedback between two variables -- complex water and sediment movements -- shape such basins.

Singer and Michaelides used data collected from the Rambla de Nogalte in southeastern Spain to model these dryland channel variables. The area has a semi-arid climate with mean annual rainfall of around 14 inches, which occurs during convective rainstorms, producing large floods that recur about once a decade.

They found that dryland channel width fluctuates downstream. Their observations show that grain size (roughness) also fluctuates from sand to gravel a downstream direction.
"There's feedback between this fluctuating width and fluctuating grain size," Singer said. "The stream flow is generated in a discontinuous pattern along the channel. Some rainstorms produce a bit of topography in some parts of the channel. Other spatial configurations of flow generated by storms destroy that topography so the variability of the rainstorms interacting with this channel are creating and destroying the topography constantly to keep it in this simple form."

Singer and Michaelides also produced simulations of extreme flows to determine the volume of flow necessary to reshape the channel completely. They examined the longitudinal variability of sediment flow as well as sediment storage to find the channel-shaping threshold. This threshold reshapes the entire channel and makes it smooth again. "It's a really significant threshold that tells us the magnitude of the flood necessary to reshape the channel," Singer said.

"Semi-arid and arid river systems are extremely important to the populations that live around them," he concluded. "Water resources are obviously a huge limitation in the development of societies, and a lot of water is being progressively diverted for irrigation, water use and other purposes, so those can further affect the spatial patterns of where flow is in these channels and potentially impact the processes of where topography develops in the river channel. Humans can inadvertently have an impact on the shape and form of river channels like these."

California's drought is the worst in 1,200 years, evidence suggests

The 2012-2014 California drought, unusual in the context of the last 1,200 years, greatly diminished water reserves in Lake Nacimiento of the upper Salinas Valley. Credit: Photo by Daniel Griffin
As California finally experiences the arrival of a rain-bearing Pineapple Express this week, two climate scientists from the University of Minnesota and Woods Hole Oceanographic Institution have shown that the drought of 2012-2014 has been the worst in 1,200 years.

Daniel Griffin, an assistant professor in the Department of Geography, Environment and Society at the University of Minnesota, and Kevin Anchukaitis, an assistant scientist at Woods Hole Oceanographic Institution, asked the question, "How unusual is the ongoing California drought?" Watching the severity of the California drought intensify since last autumn, they wondered how it would eventually compare to other extreme droughts throughout the state's history.

To answer those questions, Griffin and Anchukaitis collected new tree-ring samples from blue oak trees in southern and central California. "California's old blue oaks are as close to nature's rain gauges as we get," says Griffin. "They thrive in some of California's driest environments." These trees are particularly sensitive to moisture changes and their tree rings display moisture fluctuations vividly.

As soon as the National Oceanic and Atmospheric Administration (NOAA) released climate data for the summer of 2014, the two scientists sprang into action. Using their blue oak data, they reconstructed rainfall back to the 13th century. They also calculated the severity of the drought by combining NOAA's estimates of the Palmer Drought Severity Index (PDSI), an index of soil moisture variability, with the existing North American Drought Atlas, a spatial tree-ring based reconstruction of drought developed by scientists at Columbia University's Lamont-Doherty Earth Observatory. These resources together provided complementary data on rainfall and soil moisture over the past millennium. Griffin and Anchukaitis found that while the current period of low precipitation is not unusual in California's history, these rainfall deficits combined with sustained record high temperatures created the current multiyear severe water shortages. "While it is precipitation that sets the rhythm of California drought, temperature weighs in on the pitch," says Anchukaitis.

"We were genuinely surprised at the result," says Griffin, a NOAA Climate & Global Change Fellow and former WHOI postdoctoral scholar. "This is California--drought happens. Time and again, the most common result in tree-ring studies is that drought episodes in the past were more extreme than those of more recent eras. This time, however, the result was different." While there is good evidence of past sustained, multi-decadal droughts or so-called "megadroughts"' in California, the authors say those past episodes were probably punctuated by occasional wet years, even if the cumulative effect over decades was one of overall drying. The current short-term drought appears to be worse than any previous span of consecutive years of drought without reprieve.

Tree rings are a valuable data source when tracking historical climate, weather and natural disaster trends. Floods, fires, drought and other elements that can affect growing conditions are reflected in the development of tree rings, and since each ring represents one year the samples collected from centuries-old trees are a virtual timeline that extend beyond the historical record in North America.

So what are the implications? The research indicates that natural climate system variability is compounded by human-caused climate change and that "hot" droughts such as the current one are likely to occur again in the future. California is the world's 8th largest economy and the source of a substantial amount of U.S. produce. Surface water supply shortages there have impacts well beyond the state's borders.

With an exceptionally wet winter, parts of California might emerge from the drought this year. "But there is no doubt," cautions Anchukaitis, "that we are entering a new era where human-wrought changes to the climate system will become important for determining the severity of droughts and their consequences for coupled human and natural systems."

Source:  Woods Hole Oceanographic Institution

Early warning signals of abrupt climate change

Drought (stock image). Credit: © carloscastilla / Fotolia
A new study by researchers at the University of Exeter has found early warning signals of a reorganisation of the Atlantic ocean's circulation which could have a profound impact on the global climate system.

The research, published today in the journal Nature Communications, used a simulation from a highly complex model to analyse the Atlantic Meridional Overturning Circulation (AMOC), an important component of the Earth's climate system.

It showed that early warning signals are present up to 250 years before it collapses, suggesting that scientists could monitor the real world overturning circulation for the same signals.

The AMOC is like a conveyor belt in the ocean, driven by the salinity and temperature of the water. The system transports heat energy from the tropics and Southern Hemisphere to the North Atlantic, where it is transferred to the atmosphere.

Experiments suggest that if the AMOC is 'switched off' by extra freshwater entering the North Atlantic, surface air temperature in the North Atlantic region would cool by around 1-3°C, with enhanced cooling of up to 8°C in the worst affected regions.

The collapse would also encourage drought in the Sahel -- the area just south of the Sahara desert -- and dynamic changes in sea level of up to 80cm along the coasts of Europe and North America.

"We found that natural fluctuations in the circulation were getting longer-lived as the collapse was approached, a phenomenon known as critical slowing down," said lead author Chris Boulton.

"We don't know how close we are to a collapse of the circulation, but a real world early warning could help us prevent it, or at least prepare for the consequences" adds co-author Professor Tim Lenton.

The study is the most realistic simulation of the climate system in which this type of early warning signal has been tested.

"The best early warning signals in the model world are in places where major efforts are going into monitoring the circulation in the real world -- so these efforts could have unexpected added value' adds Professor Lenton.

SourceUniversity of Exeter

New insights into predicting future droughts in California: Natural cycles, sea surface temperatures found to be main drivers in ongoing event

Folsom Lake. Top photo taken in 2011, bottom taken in 2014.
Credit: CA Dept. of Water Resources
According to a new NOAA-sponsored study, natural oceanic and atmospheric patterns are the primary drivers behind California's ongoing drought. A high pressure ridge off the West Coast (typical of historic droughts) prevailed for three winters, blocking important wet season storms, with ocean surface temperature patterns making such a ridge much more likely. Typically, the winter season in California provides the state with a majority of its annual snow and rainfall that replenish water supplies for communities and ecosystems.

Further studies on these oceanic conditions and their effect on California's climate may lead to advances in drought early warning that can help water managers and major industries better prepare for lengthy dry spells in the future.
"It's important to note that California's drought, while extreme, is not an uncommon occurrence for the state. In fact, multi-year droughts appear regularly in the state's climate record, and it's a safe bet that a similar event will happen again. Thus, preparedness is key," said Richard Seager, report lead author and professor with Columbia University's Lamont Doherty Earth Observatory.
This report builds on earlier studies, published in September in the Bulletin of the American Meteorological Society, which found no conclusive evidence linking human-caused climate change and the California drought. The current study notes that the atmospheric ridge over the North Pacific, which has resulted in decreased rain and snowfall since 2011, is almost opposite to what models project to result from human-induced climate change. The report illustrates that mid-winter precipitation is actually projected to increase due to human-induced climate change over most of the state, though warming temperatures may sap much of those benefits for water resources overall, while only spring precipitation is projected to decrease.

The report makes clear that to provide improved drought forecasts for California, scientists will need to fully understand the links between sea surface temperature variations and winter precipitation over the state, discover how these ocean variations are generated, and better characterize their predictability.

This report contributes to a growing field of science-climate attribution-where teams of scientists aim to identify the sources of observed climate and weather patterns.

"There is immense value in examining the causes of this drought from multiple scientific viewpoints," said Marty Hoerling, report co-author and researcher with NOAA's Earth System Research Laboratory. "It's paramount that we use our collective ability to provide communities and businesses with the environmental intelligence they need to make decisions concerning water resources, which are becoming increasingly strained."

To view the report, visit: http://cpo.noaa.gov/MAPP/californiadroughtreport.

Source: National Oceanic and Atmospheric Administration

Groundwater patches play important role in forest health, water quality

This is Kevin McGuire, associate director of the Virginia Water Resources Research Center. Credit: Virginia Tech
Even during summer dry spells, some isolated patches of soil in forested watersheds remain waterlogged.

These patches act as hot spots of microbial activity that remove nitrogen from groundwater and return it to the atmosphere, researchers from several institutions, including Virginia Tech, report in a leading scientific journal.

The discovery provides insight into the health of a forest. Nitrogen is an important nutrient for plant growth and productivity, but in streams, it can be a pollutant.

"The importance of these fragmented patches of saturated soil and their role in the fate of nitrogen in forested watersheds has been underappreciated until recently," said Kevin McGuire, an associate director of the Virginia Water Resources Research Center based in Virginia Tech's College of Natural Resources and Environment, co-author of the article to be published in the Proceedings of the National Academy of Sciences.

"We were able to determine the importance of denitrification in patches of shallow groundwater, which have largely been overlooked control points for nitrogen loss from temperate forested watersheds," McGuire said.

Most nitrogen is deposited by rain. Temperate forests receive much larger inputs of nitrogen from the atmosphere than they export to streams. Once nitrogen leaves the forest in streams, it can become a water pollutant.

"In some ecosystems, there have been long-term declines in stream water export of nitrogen when inputs have remained elevated," said co-author Christine Goodale, an associate professor of ecology and evolutionary biology at Cornell University.

"Understanding the fate of this nitrogen has been a challenge because denitrification -- a gaseous loss of nitrogen to the atmosphere -- is notoriously difficult to measure," said co-author Peter Groffman, an expert on denitrification at the Cary Institute of Ecosystem Studies.

Denitrification removes nitrogen from water and can therefore improve water quality in downstream lakes and estuaries.

However, nitrogen is also an important nutrient for plant growth in the forest so removals of nitrogen by natural processes can reduce the productivity of the forest.
The research, led by Sarah Wexler while she was a postdoctoral associate in hydrology and stable isotope geochemistry at Cornell University, took place in the Hubbard Brook Experimental Forest in the White Mountains of New Hampshire, where the atmosphere annually deposits five to seven pounds of nitrogen per acre.

The Hubbard Brook Experimental Forest is part of the National Science Foundation's Long Term Ecological Research Network.

McGuire, also an associate professor of hydrology in the Department of Forest Resources and Environmental Conservation, led another National Science Foundation-funded project at the site, which developed an organizing framework to describe and map variations of soil in the watershed that explain shallow groundwater occurrence and frequency.
Groundwater wells from this earlier study were used in the new research to monitor soils that may have had the right conditions to function as hot spots for denitrification.

At sites throughout the forest, the research team measured the presence of nitrate, a form of nitrogen that is highly mobile and reactive in the environment, determined whether the nitrate is a result of atmospheric deposition or microbial conversion, and discovered the nitrogen loss to the atmosphere.

"We were able to differentiate sources of nitrate and show that some of the nitrate was lost to the atmosphere by looking at nitrate at the atomic level, that is, at the isotopic composition of the nitrogen and oxygen in nitrate," said Wexler, who is now at the School of Environmental Sciences at the University of East Anglia in the United Kingdom. "The isotopic composition of nitrate provides a natural way to directly track the details of nitrogen cycling."

McGurie said, "Some work remains to be done, but the aim is to be able to develop a better sense of where and how nitrogen is processed in the environment and be in a position to predict how changes in climate, for example warmer and wetter conditions, affect nitrogen cycling and water quality in forested ecosystems."

SourceVirginia Tech

Colorado River Delta greener after engineered pulse of water

Water being released from Morelos Dam in the first environmental release of water to the Colorado River Delta. The Minute 319 pulse flow of water started March 23, 2014 and ended May 18, 2014. Credit: Rebecca Lester, Deakin University, Australia
The engineered spring flood that brought water to previously dry reaches of the lower Colorado River and its delta resulted in greener vegetation, the germination of new vegetation along the river and a temporary rise in the water table, according to new results from the binational team of scientists studying the water's effects.

The experimental pulse flow of water was the result of a U.S.-Mexico agreement called Minute 319.

"The pulse flow worked," said Karl W. Flessa, co-chief scientist for the Minute 319 Science Team. "A small amount of water can have a big effect on the delta's ecosystem."Starting March 23, 2014, and ending May 18, approximately 105,392 acre-feet (130 million cubic meters) of water was released into the dry river bed below Morelos Dam, which straddles the U.S.-Mexico border just west of Yuma.

"The groundwater was recharged, vegetation got greener than previous years and the water helped germinate new native vegetation," said Flessa, a University of Arizona professor of geosciences. "As a bonus, the river reached the sea."

In addition, people living along the river benefited, he said.

"People in the communities along the river were just overjoyed to see their river again," he said. "When the surface water was there, people celebrated. Kids who'd never seen water in the river before got to splash in it."

The science team includes more than 21 scientists from universities, government agencies and nongovernmental organizations from both Mexico and the U.S, including the UA, the Universidad Autónoma de Baja California, the U.S. Geological Survey, the U.S. Bureau of Reclamation, The Nature Conservancy, the Tucson-based Sonoran Institute and the Ensenada-based Pronatura Noroeste.

Flessa will present the team's findings at his talk, "The Science and Policy of the First Environmental Flows to the Colorado River Delta," on Dec. 18 as part of the American Geophysical Union's annual meeting in San Francisco.

Although most of the water soaked into the ground in the 37 miles (60 km) below the dam, the river's surface flow reached areas farther downstream that had been targeted for restoration. The increase in groundwater revived vegetation along the entire 83-mile (134 km) route to the sea.

By comparing Landsat 8 satellite images from August 2013 with those from August 2014, team members calculated a 23 percent increase in the greenness of riparian zone vegetation.
Although the groundwater did eventually recede, the surface water caused the germination of new willows and cottonwoods. Those plants germinate after natural spring floods, and their roots can grow fast enough to keep up with the receding water table.

The surface water reached the restoration sites prepared by the Sonoran Institute and Pronatura Noroeste and helped establish native vegetation.

"So long as the roots get down into the permanent water table, then you have established a new bunch of trees that will then live for 20, 30, 40 years," Flessa said. "Those trees will attract birds."

The scientists already observed an increase in the numbers of birds, he said.
Learning where the newly germinated plants survived past the first summer will help the researchers figure out where ecosystem restoration will do the most good using the least amount of water, he said.

"The water that soaked into the ground is also good for the farmers," Flessa said. "It raises the water table and they pump that water -- so this isn't just about trees and birds."
The team will continue to monitor the lower Colorado River Delta's vegetation and hydrological response to the pulse flow, including the long-term effect on groundwater. They will also study how the new vegetation affects both resident birds and those migrating along the Pacific Flyway.

The five-year program to monitor the environmental results of the pulse flow is being supported by government agencies and environmental groups in both countries, under the auspices of the International Boundary and Water Commission.

The Minute 319 pulse flow is part of a five-year agreement (2012-17) adopted by the International Boundary and Water Commission, under the framework of a 1944 U.S. -- Mexico treaty that governs water allocations on the Colorado River between the two countries.

The agreement provides multiple benefits for Colorado River water users in both countries, including environmental flows to the delta. Minute 319 identifies criteria for sharing of future water shortages and surpluses between the two countries, allows storage of Mexican water in Lake Mead and supports improvements to Mexican irrigation infrastructure.
"Another pulse flow would require a new agreement, because Minute 319 calls for only one pulse flow within the five-year term of the minute," Flessa said. "We hope the results of this pulse flow encourage the negotiators to make this happen again."

Source: University of Arizona

NASA data underscore severity of California drought

Trends in total water storage in California, Nevada and bordering states from NASA's Gravity Recovery and Climate Experiment (GRACE) satellite mission, September 2011 to September 2014. NASA scientists use these images to better quantify drought and its impact on water availability. Two-thirds of the measured losses were a result of groundwater depletion in California's Central Valley. Credit: NASA JPL/Caltech
It will take about 11 trillion gallons of water (42 cubic kilometers) -- around 1.5 times the maximum volume of the largest U.S. reservoir -- to recover from California's continuing drought, according to a new analysis of NASA satellite data.

The finding was part of a sobering update on the state's drought made possible by space and airborne measurements and presented by NASA scientists Dec. 16 at the American Geophysical Union meeting in San Francisco. Such data are giving scientists an unprecedented ability to identify key features of droughts, and can be used to inform water management decisions.

A team of scientists led by Jay Famiglietti of NASA's Jet Propulsion Laboratory in Pasadena, California, used data from NASA's Gravity Recovery and Climate Experiment (GRACE) satellites to develop the first-ever calculation of this kind -- the volume of water required to end an episode of drought.

Earlier this year, at the peak of California's current three-year drought, the team found that water storage in the state's Sacramento and San Joaquin river basins was 11 trillion gallons below normal seasonal levels. Data collected since the launch of GRACE in 2002 show this deficit has increased steadily.

"Spaceborne and airborne measurements of Earth's changing shape, surface height and gravity field now allow us to measure and analyze key features of droughts better than ever before, including determining precisely when they begin and end and what their magnitude is at any moment in time," Famiglietti said. "That's an incredible advance and something that would be impossible using only ground-based observations."

GRACE data reveal that, since 2011, the Sacramento and San Joaquin river basins decreased in volume by four trillion gallons of water each year (15 cubic kilometers). That's more water than California's 38 million residents use each year for domestic and municipal purposes. About two-thirds of the loss is due to depletion of groundwater beneath California's Central Valley.

In related results, early 2014 data from NASA's Airborne Snow Observatory indicate that snowpack in California's Sierra Nevada range was only half of previous estimates. The observatory is providing the first-ever high-resolution observations of the water volume of snow in the Tuolumne River, Merced, Kings and Lakes basins of the Sierra Nevada and the Uncompahgre watershed in the Upper Colorado River Basin.

To develop these calculations, the observatory measures how much water is in the snowpack and how much sunlight the snow absorbs, which influences how fast the snow melts. These data enable accurate estimates of how much water will flow out of a basin when the snow melts, which helps guide decisions about reservoir filling and water allocation.

"The 2014 snowpack was one of the three lowest on record and the worst since 1977, when California's population was half what it is now," said Airborne Snow Observatory Principal Investigator Tom Painter of JPL. "Besides resulting in less snow water, the dramatic reduction in snow extent contributes to warming our climate by allowing the ground to absorb more sunlight. This reduces soil moisture, which makes it harder to get water from the snow into reservoirs once it does start snowing again."

New drought maps show groundwater levels across the U.S. Southwest are in the lowest 2 to 10 percent since 1949. The maps, developed at NASA's Goddard Space Flight Center in Greenbelt, Maryland, combine GRACE data with other satellite observations.

"Integrating GRACE data with other satellite measurements provides a more holistic view of the impact of drought on water availability, including on groundwater resources, which are typically ignored in standard drought indices," said Matt Rodell, chief of the Hydrological Sciences Laboratory at Goddard.

The scientists cautioned that while the recent California storms have been helpful in replenishing water resources, they aren't nearly enough to end the multi-year drought.
"It takes years to get into a drought of this severity, and it will likely take many more big storms, and years, to crawl out of it," said Famiglietti.

NASA monitors Earth's vital signs from land, air and space with a fleet of satellites and ambitious airborne and ground-based observation campaigns. The agency develops new ways to observe and study Earth's interconnected natural systems with long-term data records and computer analysis tools to better see how our planet is changing. The agency shares this unique knowledge with the global community and works with institutions in the United States and around the world that contribute to understanding and protecting our home planet.

For more information on GRACE, visit: http://www.nasa.gov/grace and http://www.csr.utexas.edu/grace
For more on the Airborne Snow Observatory, visit: http://aso.jpl.nasa.gov/
For more information about NASA's Earth science activities, visit: http://www.nasa.gov/earthrightnow

Source: NASA/Jet Propulsion Laboratory

Residual hydraulic fracturing water not a risk to groundwater

Sixty-one minutes of imbibition and evaporation of a 154 microliter bead of tap water on a 2.3 gram chip of the Union Springs Member of the Marcellus Formation. The drop disappeared in approximately 100 minutes. The photograph labeled 0 min was taken about 10 seconds after the bead was dropped on the Marcellus chip. Counter-current imbibition is indicated by methane bubbles floating up into the water bead from the Marcellus chip, starting on the left side of the bead at time = 0 min. This experiment was started 5 days after receiving fresh cuttings of the Union Springs from a horizontal well in PA.
Credit: Engelder, Penn State
Hydraulic fracturing -- fracking or hydrofracturing -- raises many concerns about potential environmental impacts, especially water contamination. Currently, data show that the majority of water injected into wells stays underground, triggering fears that it might find its way into groundwater. New research by a team of scientists should help allay those fears.

In a paper published in the current issue of the Journal of Unconventional Oil and Gas Resources, Terry Engelder, professor of geosciences, Penn State; Lawrence Cathles, professor of earth and atmospheric sciences, Cornell University; and Taras Bryndzia, geologist, Shell International Exploration and Production Inc., report that injected water that remains underground is sequestered in the rock formation and therefore does not pose a serious risk to water supplies.

Hydraulic fracturing is a drilling technique commonly used to extract gas from previously inaccessible "tight" gas reserves, including gas trapped in shale formations such as the Marcellus. During this technique between 1.2 and 5 million gallons of water mixed with sand and chemical additives are injected at high pressure into each well to fracture the rock and release the gas.

Typically less than half of the injected water returns to the surface as "flowback" or, later, production brine, and in many cases recovery is less than 30 percent. In addition to the chemical additives, flowback water contains natural components of the gas shale including salt, some metals, and radionuclides and could impair water quality if released without proper treatment. While flowback water can be managed and treated at the surface, the fate of the water left in place, called residual treatment water or RTW, was previously uncertain.

Some have suggested that RTW may be able to flow upward along natural pathways, mainly fractures and faults, and contaminate overlying groundwater. Others have proposed that natural leakage of the Marcellus is occurring without human assistance through high-permeability fractures connecting the Marcellus directly to the water table and that hydraulic fracturing could worsen this situation.

The researchers report that ground water contamination is not likely because contaminant delivery rate would be too small even if leakage were possible, but more importantly, upward migration of RTW is not plausible due to capillary and osmotic forces that propel RTW into, not out of, the shale. Their study indicates that RTW will be stably retained within the shale formation due to multiphase capillary phenomena.

"Capillary forces and coupled diffusion-osmosis processes are the reasons the brines and the RTW are not free to escape from gas shale," said Engelder. "The most direct evidence of these forces is the observation that more than half the treatment waters are not recovered. Introducing treatment water causes gas shale to act like a sponge based on the principles of imbibition.

"Imbibition into gas shale is made possible by the high capillary suction that a fine-grained, water-wet shale matrix can exert on water. As water is wicked into gas shale, the natural gas in the shale is pushed out. The capillary forces that suck the RTW into the gas shale keep it there."

Estimating imbibition is complicated, but simple experiments conducted by the researchers show that water can be readily imbibed into gas shale in quantities fully capable of sequestering RTW. The researchers demonstrated this process in a series of experiments on cuttings recovered from the Union Springs Member of the Marcellus gas shale in Pennsylvania and on core plugs of Haynesville gas shale from NW Louisiana.

"The hydraulic fracturing fluid consists mostly of very low-salinity surface water, while the shale contains high concentrations of water soluble inorganic cations and anions," said Engelder. "During hydraulic fracturing water is lost to the formation while inorganic cations and anions are transferred from the formation to the hydraulic fracture. Diffusion osmosis assists the rapid imbibition of water by the shale and diffusion of ions into the treatment water causing the high salinities observed in flowback fluids. The point to be emphasized here is that this osmotic pressure pushes the hydraulic fracture fluids into the shale matrix, expelling gas and cations to make high-salinity flowback in the process."

The researchers believe that in addition to there not being enough water in the shale to contaminate groundwater, the most important point of their work is that multiphase capillary phenomena must be considered in cases where a non-aqueous fluid is present in the subsurface pore space. The vadose zone -- the area from the surface to the groundwater -- and oil and gas migration cannot be understood using single-phase, porous-media flow methods, and any policy insights or prescriptions based on single-phase considerations will be fatally flawed, they argue.

"The practical implication is that hydrofracture fluids will be locked into the same 'permeability jail' that sequestered overpressured gas for over 200 million years," said Engelder. "If one wants to dispose of fracking waters, one could probably not choose a safer way to do so than to inject them into a gas shale."

Source: Penn State
Environment Now
Technology+Physics
Health + Medicine
Plants + Animals
SPACE + TIME
Science + Society

 
BREAKING NEWS